 In this blog, we will dive into the attack trends observed across our customers’ networks. First, we will highlight how the security threat intelligence in the Juniper Advanced Threat Prevention (ATP) product works. We will present the attack trends observed in Q3 of 2023 by comparing several aspects of the SecIntel Threat Intelligence feed. Additionally, we will look at various characteristics of each telemetry event, including threat severity, protocol, threat categories, and geographical presence. We conclude with insightful takeaways on emerging threat trends.
What is SecIntel?
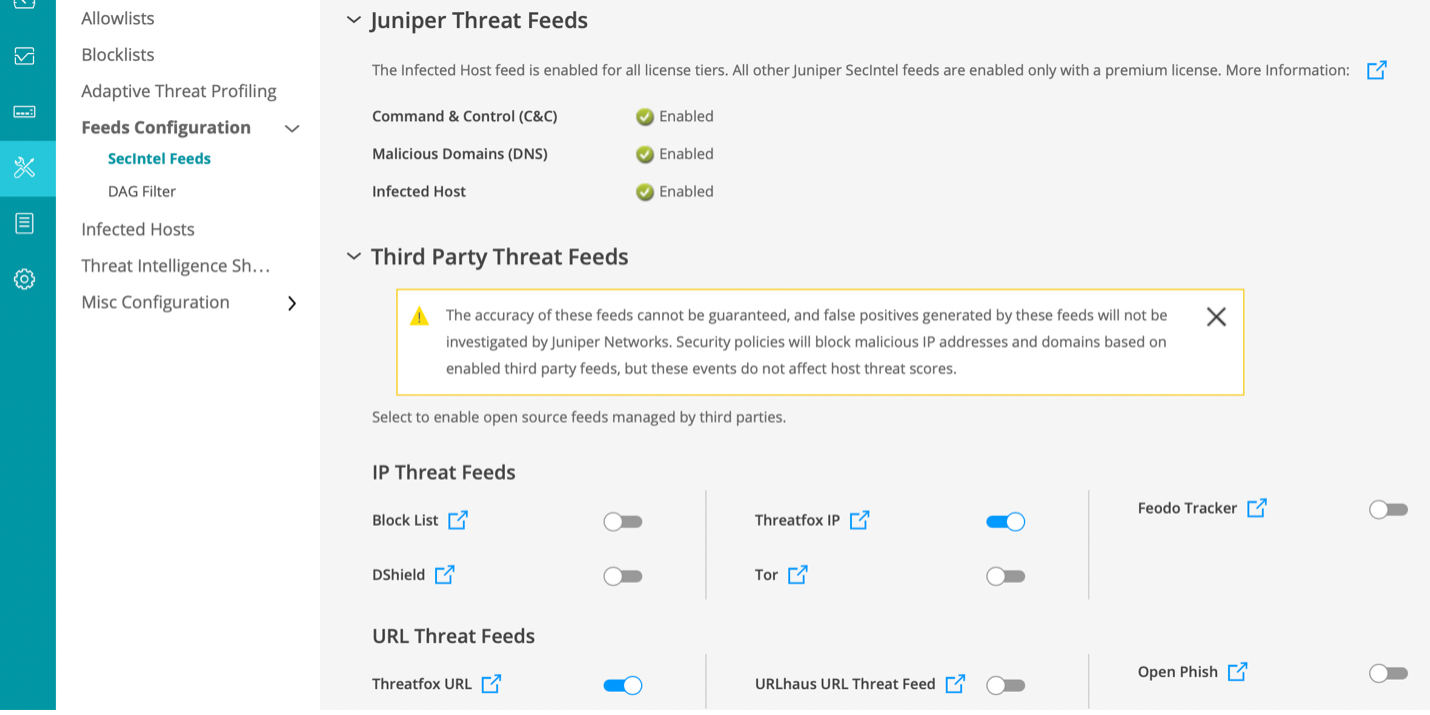
Juniper Threat Labs (JTL) provides a security intelligence feed known as SecIntel. SecIntel is part of the Advanced Threat Prevention service that integrates into Juniper devices like the SRX Series Firewalls and MX Series Routers. The SecIntel threat feed is a list of known emerging threats composed of threat intelligence that is carefully curated and vetted for quality. In raw form, SecIntel is a list of indicators or artifacts that can be either an IP address, domain, or URL. Quality checks are very important and ensure that no false positive indicators cause any disruption to our customers. Additionally, the ATP platform allows customers to integrate open source and third-party threat intelligence, providing additional coverage. ATP allows customers to import the following threat feeds:
- Blocklist.de
- DShield
- Threatfox
- Feodo Tracker
- URLHaus
- Open Phish
However, since these third-party feeds come from external sources, Juniper does not modify them to ensure their quality. Customers will see this notice on their ATP portal:
The accuracy of these feeds cannot be guaranteed, and false positives generated by these feeds will not be investigated by Juniper Networks. Security policies will block malicious IP addresses and domains based on enabled third party feeds, but these events do not affect host threat scores.
In addition to those third-party feeds, ATP allows customers to upload their own custom feed. The following figure shows the configuration panel where customers can configure the SecIntel feed:
Each artifact also has properties attached to it, such as the category and threat level. The category describes the type of threat infrastructure. For example, malware can send stolen information to an IP address drop site. The threat level indicates the severity of the threat. Threat levels range from one to ten, where ten is the most severe and one is the least severe or dated information.
How Do the SRX Series Firewalls Use SecIntel?
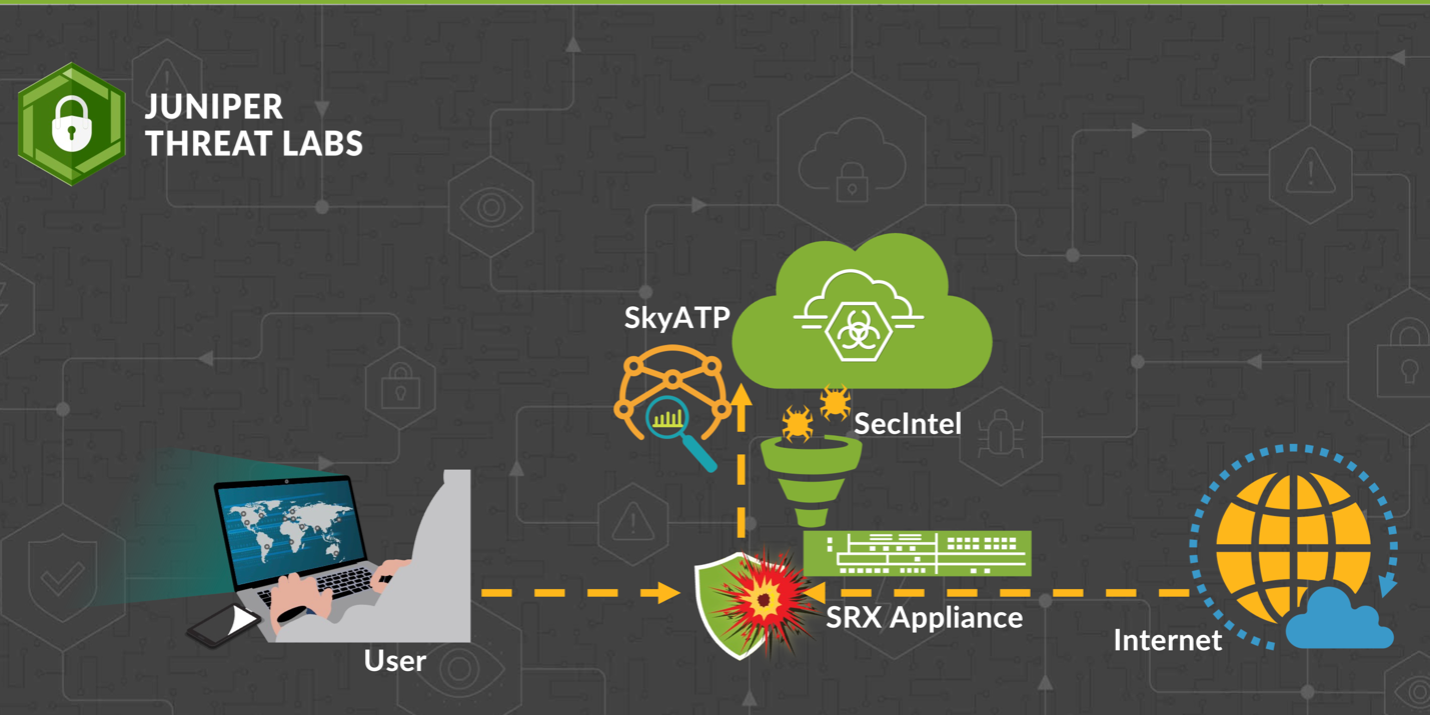
The SecIntel feed is an aggregate list of high-quality threat intelligence feeds. The feeds consist of commercial and internal indicators. JTL collects internal indicators by aggregating and filtering threat observations from globally deployed sensors. The SecIntel feed is automatically downloaded by all devices with a SecIntel subscription. The following figure illustrates how the SRX devices use the SecIntel feed.
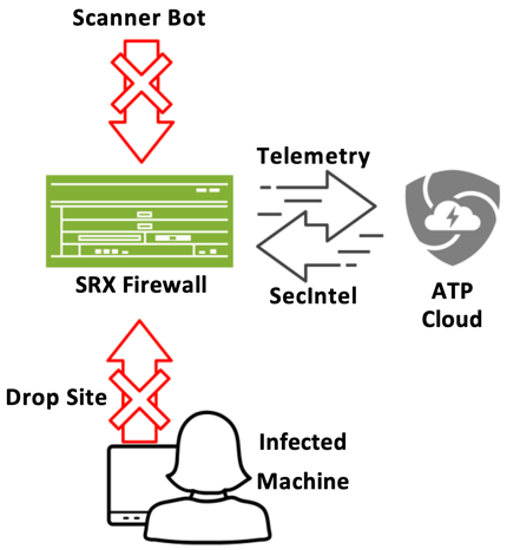
SRX devices will monitor connections that originate inside or outside the customer network and act based on the policy configuration and intelligence from the SecIntel feed. For example, if an IP address on the SecIntel feed is associated with a botnet scanner, the SRX device could drop those inbound connections. Similarly, if there is a malware infection on a customer’s network and the malware sends sensitive credentials to an IP address on the feed, the SRX can block those outbound connections.
The SRX receives the latest SecIntel feed from ATP Cloud hourly to ensure customers are protected against the most recent threats. SRX blocks traffic according to the severity of the threat and the policy configuration.The blocking policy can be configured by the customer to selectively block only specific threat levels (i.e., threat level seven or higher). However, any network traffic that matches an indicator on the SecIntel feed will generate a telemetry event that will be sent back to ATP Cloud. Telemetry information includes all threat levels. Next, we will dive into a sample of the telemetry data observed across customer networks.
Overview of SecIntel Detections
Juniper Threat Labs sampled 10 million telemetry events observed in 100 customer networks from July to September 2023. The following trends and statistics are based on these telemetry data. We observed approximately 16K unique indicators or artifacts found on the SecIntel list. Of the 16k indicators, 83% come from JTL internal threat feeds and 17% come from open source feeds like the ones highlighted above. The following figure presents the percentage of sampled events that were blocked or allowed based on the SecIntel feed.
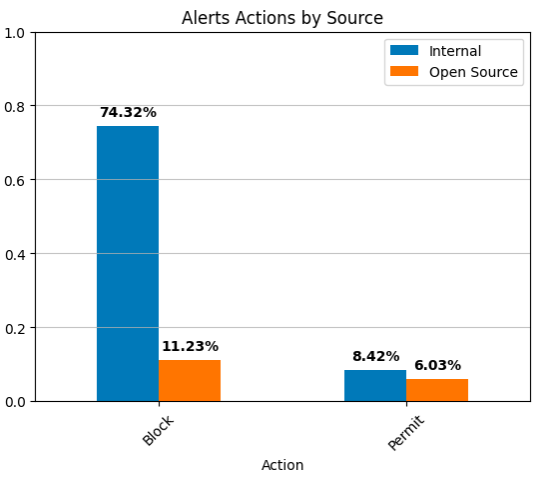
The blue bar represents the internal feeds, and the orange bar represents the open source feeds. We find that the percentage of actions resulting in a block is approximately 86%, while the percentage of actions resulting in a permit is approximately 14%. We can see that about 74% of the blocked indicators are found in the JTLinternal feed and 11% come from open source.
In terms of severity, most (60%) of the events had a threat level of ten. The following figure shows the distribution of threat levels. The default block policy for the threat level is set to six and above, which represents about 75% of the logged alerts.
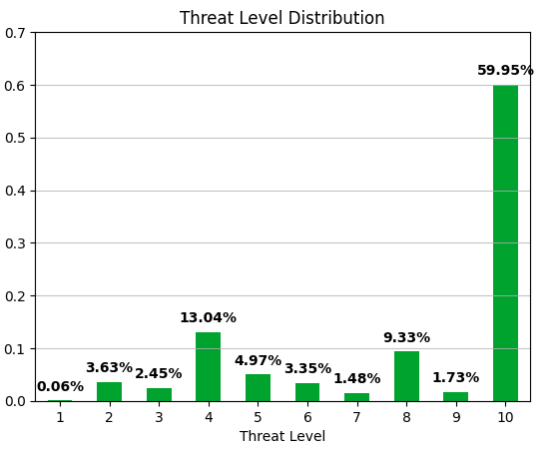
What about the lower threat levels, such as levels one through five? JTL implements a decay algorithm that reduces the threat level of an indicator over time as attackers abandon their infrastructure. If the indicator is observed again in an active attack, the threat level is elevated to keep customers protected. Decay removes stale indicators that were abandoned by an attacker and no longer pose a threat. By doing so, we ensure thatfalse alerts are minimized in case the same infrastructure is reused for legitimate purposes like in the case of cloud services and shared hosting. An added benefit to this decay approach is that it provides performance improvements to ensure that Juniper devices have the most relevant threat indicators and operate at an optimal level.
When an indicator is observed by one of the SRX devices, the telemetry logs information about the protocol, port, source, and destination IP addresses. This information allows customers to identify which device on their network is associated with the alert. The following figure provides an overview of the protocols associated with the generated alerts.
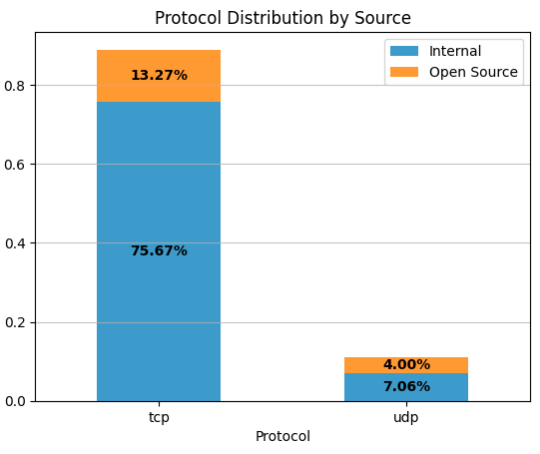
We observed that 89% of the alerts are associated with the TCP protocol and about 11% are associated with UDP. Furthermore, Figure 6 shows a comparison between internal and open source feeds. As discussed above, the internal feed has better coverage; therefore, the figure follows a similar distribution.
Destination ports associated with the SecIntel feed vary widely. However, some popular ports, such as 443 (HTTPS) and 80 (HTTP), are more prominent in the sampled data.
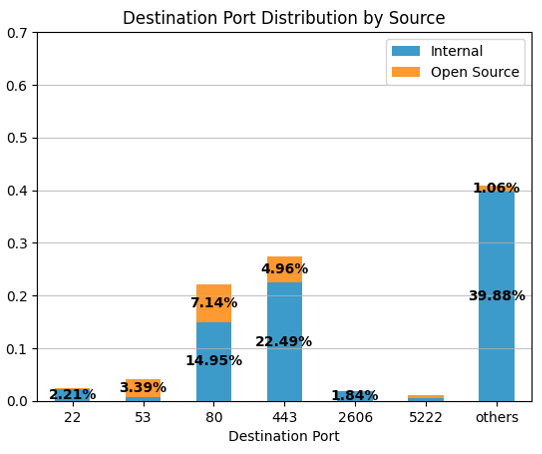
We observed that Ports 443 and 80 make up about 49% of the destination ports. However, this distribution hasa long tail, as shown by the category of “others”. This means that many indicators are associated with a wide range of destination ports. Specifically, we observed 65,524 unique ports (almost the entire range) in this sample data. Attackers often use a high-range port value to evade firewall policies.
Furthermore, Figure 6 above differentiates between internal and open source feeds. We observed that most of the open source feed is centered around ports 53, 80 and 443. Specifically, open source feed alerts are associated with 10,876 unique destination ports, while internal feed alerts are associated with 65,523 unique destination ports. This implies that the internal feed has more diversity in terms of threat detection than the open source feed.
Next, we will look at the characteristics of blocked infrastructure based on IP intelligence. We mentioned earlier that about 16K unique IP addresses are found in the 10M alert sample. We used VirusTotal to get IP intelligence data using their VTIntelligence API. We also used VirusTotal as a proxy to estimate the detection coverage of public threat intelligence platforms. VirusTotal has coverage for about 25% of the IP addresses (4k/16k). The following bar graph in Figure 7 shows the coverage percentage per source category, Internal versus open source:
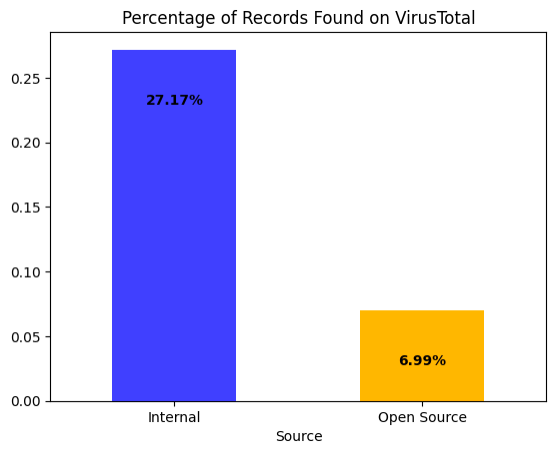
The VirusTotal platform covers about 27% of the internal and 7% of the open source feed. This indicates that the SecIntel feed contains mainly new and relevant threat infrastructure not known before blocked alerts. Additionally, this coverage is an overestimate since the look-up for the IP addresses is three months after the block event.
We also used VirusTotal to get a sense of the malicious file types associated (communicated with or downloaded from) the blocked infrastructure. Figure 8 provides a breakdown of the file types associated with the blocked infrastructure.
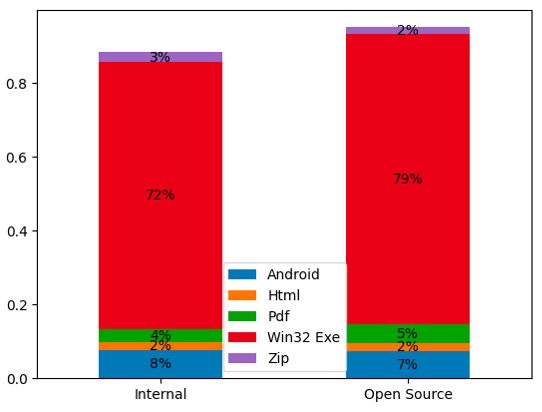
We observe that Windows executables make up the bulk of the associated files. The distribution of file types appears to be similar for both internal and open source threat feeds. It is important to note that the figure above shows the top five file types. There are 42 and 34 file types associated with the internal and open source threat feed, respectively.
We also looked at the types of malicious files associated with the blocked events. The following table provides a list of the top ten threat categories for each threat feed.
| Internal Threat Feed | Open Source Threat Feed | ||
| Trojan | 83.81% | Trojan | 88.59% |
| Virus | 6.35% | Phishing | 3.89% |
| Adware | 2.87% | Virus | 2.66% |
| Phishing | 2.11% | Adware | 1.95% |
| Worm | 2.10% | Worm | 1.20% |
| Downloader | 1.12% | Downloader | 0.77% |
| PUA | 0.65% | PUA | 0.43% |
| Miner | 0.57% | Miner | 0.28% |
| Hacker Tool | 0.20% | Ransomware | 0.09% |
| Dropper | 0.12% | Dropper | 0.06% |
| Ransomware | 0.09% | Hacker Tool | 0.04% |
| Banker | 0.01% | Banker | 0.03% |
Figure 9: Top ten threat categories for each threat feed.
We find that the distribution of threat categories is similar. However, it is important to note that these categories are based on the VirusTotal coverage of threats associated with blocked connections. The top five threat categories are Trojan, Virus, Adware, Phishing, and Worm for both internal and open source threat feeds. This distribution implies that the threat feeds provide wide coverage for different threat categories.
How widespread are the blocked threats? To assess the ubiquity of threats, we looked at the blocked alerts forall customers found in the sampled data. The following figure plots the cumulative distribution of the alerts observed by all customers in the sample.
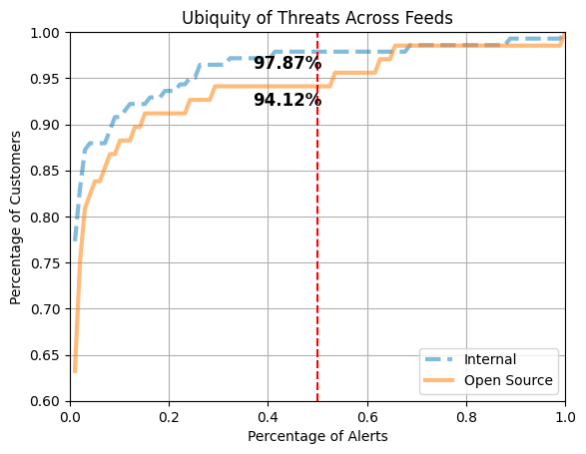
The X-axis represents the percentage of alerts and the Y-axis represents the percentage of customers. The red dotted line marks 50% of the alerts. The blue dotted and orange solid lines represent the threat feeds for the internal and open source categories, respectively. We observed that 50% of the internal feed alerts are seen by 97.87% of customers, while 50% of the open source feed alerts are seen by 94.12% of customers. The difference can be explained by the fact that not all customers use open source threat feeds since they require customers to enable them manually. The remaining 50% of the alerts are seen by a small set of customers, 2.13% and 5.88% for internal and open source feeds, respectively.
Finally, we examine the geographical distribution of the blocked infrastructure. The following graph shows the distribution of blocked IP addresses for the top ten countries.
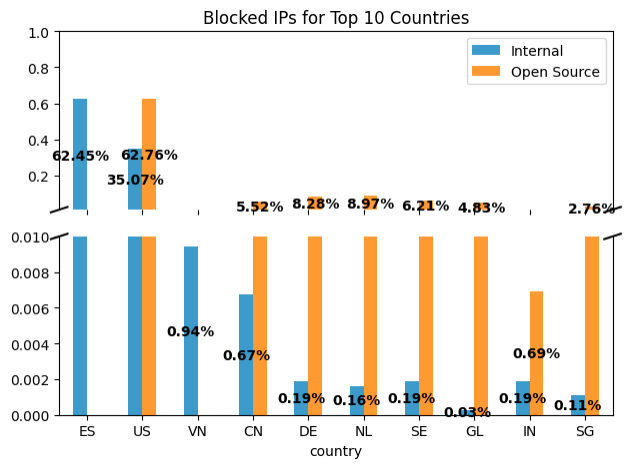
We observed that the total VirusTotal coverage of the internal feed to be concentrated in Spain(62.45%) and the United States (35.07%). Open source feed has most of the infrastructure in the United States (62.76%). Additionally, the open source feed appears to have more geographical diversity than the internal feed for the VirusTotal covered data. However, this does not necessarily indicate that either feed is better. When we examine the geographical distribution for the top three threat categories, we find interesting trends, as shown in the following graph.
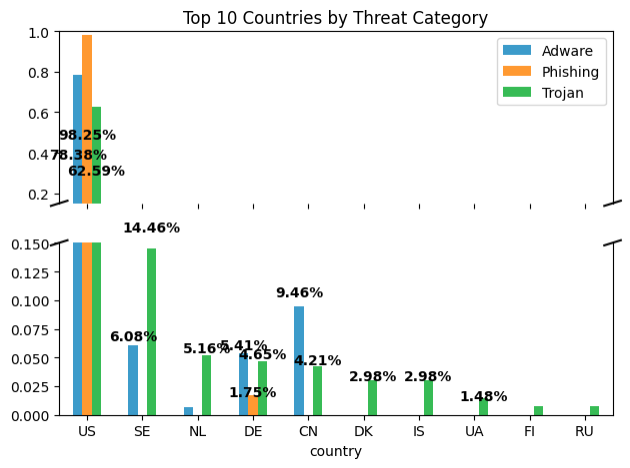
Throughout the research, we found that infrastructure located in the United States appears to be morefavorable for phishing, while Trojan threats appear to have a more diverse geographical presence. For the Adware category, we found that the United States, China, and Sweden to be the top geographical presence for their infrastructure. These trends indicate that the threat types have some preferred geographical presence, with the United States being the top choice based on VirusTotal data. However, geographical preference can also potentially be attributed to the concentration of hosting services or the coverage of threat intelligence.
Conclusion
Throughout this blog, we identified several important takeaways. First, coverage and quality are important characteristics of threat intelligence feeds. We showed that the Juniper Threat Labs’ internal threat feed has more coverage for threats due to the diversity of ports, threat categories, and file type associations. Furthermore, the coverage observed in VirusTotal indicates that the internal feed may be more representative of emerging threats than the open source feeds. VirusTotal indicates popular threats across their large user base. The more users report a threat, the more likely we will observe it in VirusTotal. We show that 50% ofblocked alerts appear ubiquitous across many customers, while the remaining 50% appear to have a low prevalence. Finally, geographic distribution implies that specific threat categories favor hosting infrastructure in one or two countries, and others are less particular about their geography. It is important to note that the data from VirusTotal do not provide complete coverage, and therefore we must be careful with any conclusive observations. Customers with an active Advanced or Premium license automatically get the latest SecIntel feed. Customers who want to use open source feeds must explicitly enable them in the ATP management portal.

