We’ve all experienced the frustration of being in a Zoom or Microsoft Teams call where the audio is poor or perhaps the video is lagging. This disruption to collaboration and communication results in a poor user experience for everyone, which can be detrimental to productivity. To determine the issues associated with a poor Zoom or Teams call, Juniper Networks has employed data analytics to show site or access point (AP) performance and AI algorithms to predict conferencing performance metrics to find the root cause of any issues. In this blog, we describe the data analytics methods and an AI model that provides insights and predictions for the quality of a Zoom or Teams call experience. We also show how we determine the root cause of meeting issues by combining Zoom or Teams data with Juniper Mist network data. With this integration, we’re now able to demonstrate how our AI model successfully detects various client, Wi-Fi and WAN issues affecting Zoom calls.
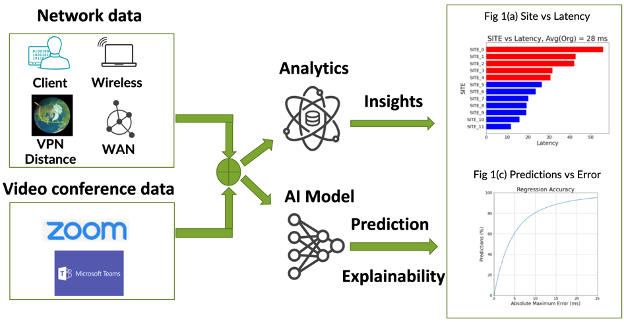
Figure 1: Overview of data analytics and AI models to provide insight and interpretability of audio/video conferencing calls. Enlarged versions of Figure 1(a) and (b) are shown below.
Process Overview
Both Zoom and Teams provide metrics that quantify call quality. For example, the Zoom QoS API provides per-minute statistics on the latency, packet loss and jitter for every call (see Introduction to Zoom APIs).
Video conference data can be combined or ‘joined’ with Juniper Mist network data. By combining the data, we study relationships between the audio and video performance metrics and the network and client parameters. Figure 1 shows an overview of the process for ingesting Zoom or Teams data with Juniper Mist network data to obtain data analytics insights, the predictive power of AI and the objective explainability of why a Zoom call performed the way it did.
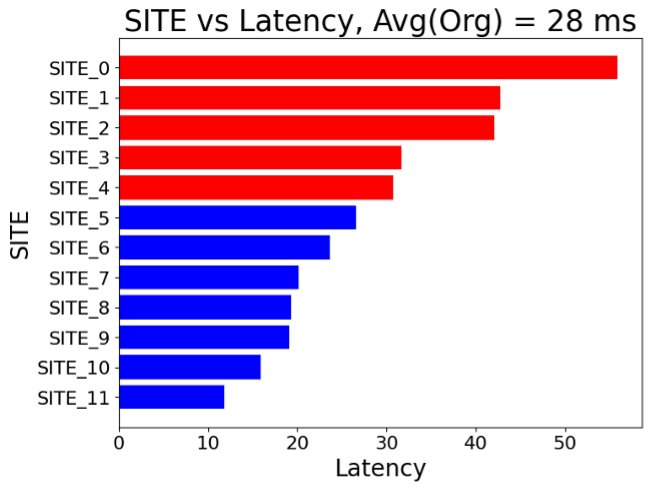
Figure 1(a). Site vs Audio Latency for a Juniper organization. The average latency for the organization is 28 ms. Sites with audio latencies significantly higher than the average are shown in red, while sites with a significantly better average latency are shown in blue.
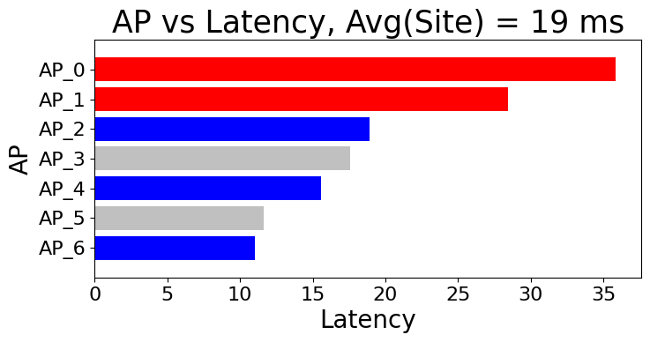
Figure 1(b). Access Point vs Audio Latency from the Juniper site is shown in Figure 1(a). The average latency for the site is 19 ms. Access points with audio latencies significantly higher than the average are shown in red, while significantly lower access points are shown in blue. Access points with latencies not statistically different from the average are shown in grey.
Data Analytics
Once the video conferencing and network data are joined, data analytics can provide insight and we can monitor performance at the Juniper site, access point (AP) or client level. For example, Figure 1(a) shows the average Zoom audio latency for sites in an anonymized Juniper organization. For the entire organization, the average audio latency is 28 milliseconds (ms). The top four sites (shown in red) have a statistically significant higher/worse audio latency than the organization’s average. Furthermore, the bottom seven sites (shown in blue) have a statistically significantly better/lower latency than the average. Using the same process, Figure 1(b) shows access points (APs) from one site in the organization and their average latencies. The graphs allow you to detect sites or APs that are worse than average but cannot directly identify the reason for the poor performance. To determine the root cause of issues, we employ artificial intelligence (AI) methods.
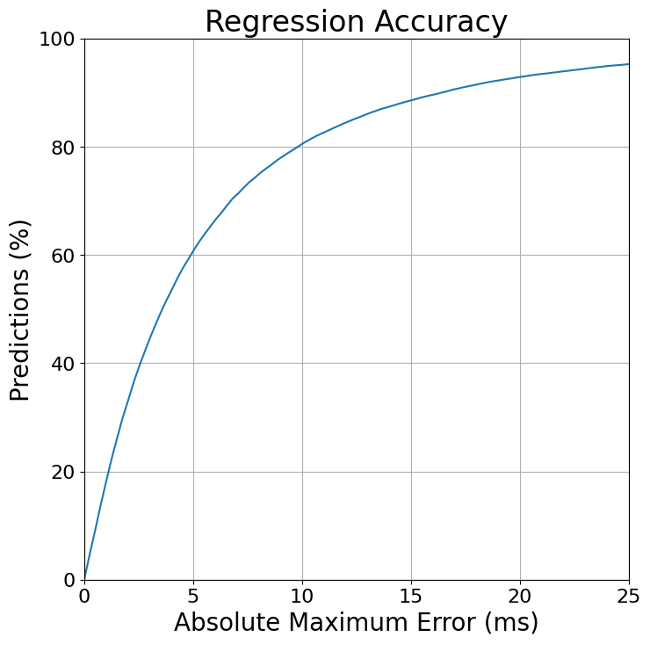
Figure 1(c).Percentage of predictions of Audio latency versus the maximum latency error.
Benefits of Developing an AI Model
The Juniper Mist AI engine currently collects data for over a million Zoom client minutes daily. The vast amount of data enables us to develop an accurate AI model to predict the observed Zoom or Teams performance metrics from the Juniper Mist data alone and determine the root cause of any issues. With a precise model, we can then provide customers with a prediction and explanation of their Zoom or Teams call before or after a user makes the call. For example, the AI model could provide a graph like Figure 1(b), using the predicted audio latency as a function of AP. Thus, network admins can determine if their site, zone, access point or individual client will have a positive audio/video conferencing experience.
To be effective, the model must be highly accurate. Figure 1(c) shows the accuracy of our model to predict audio input latency. The graphs show that 80% of predictions are within 10ms of the observed latency, while 90% of predictions are within 20ms and thus offer a high degree of accuracy. Once an accurate model has been trained, the AI model can be used to explain the dominant network characteristics that contribute most to the predicted performance metric.
Next, we’ll review Shapley Values, a Nobel-prize winning concept from game theory, that is key to determining and explaining dominant network characteristics that impact experience.
Explainability with Shapley Values
Shapley values are the average marginal contribution of a feature value across all possible combinations of feature values. Think of features as network characteristics like latency, RSSI, etc. In the case of predicting the latency of a Zoom or Teams video, consider a simple AI model consisting of four Juniper network variables or ‘features,’ including:
- AP’s radio utilization

- Client’s received signal strength indicator (RSSI)

- Average round trip time of an AP communicating with the Juniper Mist cloud

- The total number of clients connected to an AP
Suppose we want to determine the audio latency based on the total number of clients on an AP. To calculate the Shapley value, we need to find the weighted average of marginal contribution for all possible combinations or coalitions with and without the feature. Figure 2 shows all possible coalitions of three features. If a feature is not explicitly stated in the coalition, it is given a random value.
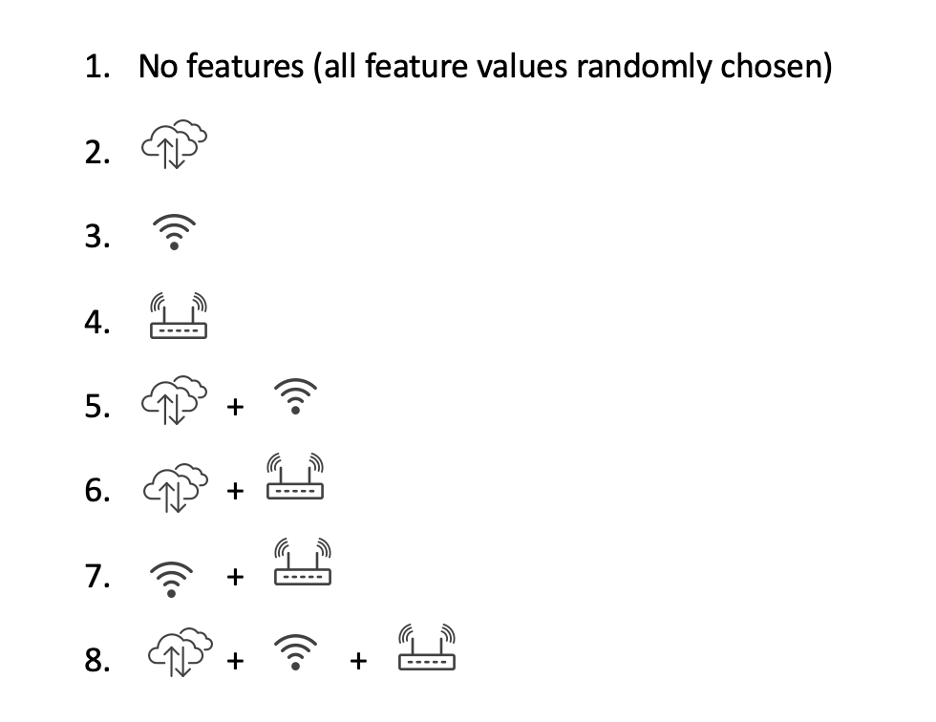
Figure 2: All eight possible combinations of features for calculating the Shapley value.
The AI model predicts the latency for all of these coalitions with and without the total number of clients on the AP for any observation. The weighted average of all these is our feature’s Shapley value. Thus, we get a fair, unbiased allocation of a feature’s contribution to the total latency! Shapley values can be computationally expensive, especially as the number of features increases. For our application, GPUs can accelerate SHAP calculations, as previously shown in this blog.
Shapley Values in Action
Below, we show examples of Shapley analysis for Juniper sites, APs and clients. Figure 3 shows a site-level Shapley analysis with all model feature values in the column and a bar for each feature showing its calculated mean absolute impact.
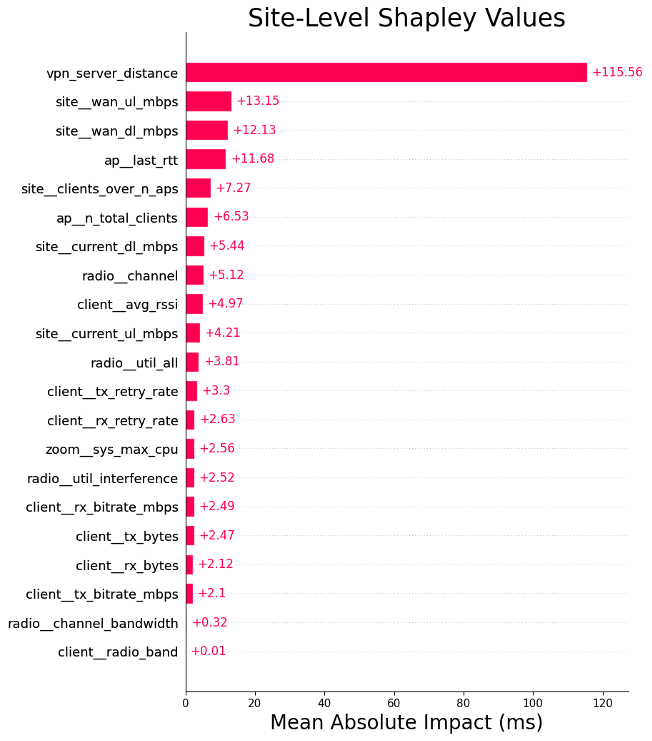
Figure 3: Shapley feature importance graph showing the mean absolute impact for a Juniper site located in Hyderabad, India.
In Figure 3, the dominant feature, leading to a calculated mean absolute impact of 115ms to the predicted latency, is the VPN server distance feature. This feature is the distance in kilometers between the client’s VPN server and the client’s current location. The model and resulting Shapley analysis have shown the importance of this feature: if a client is connected to a VPN server that is far away, the Zoom latency is greater. That makes sense, right?
Zoom had recognized that connecting to a VPN server can be associated with poor Zoom experiences (see Zoom’s recommendations on VPN Split Tunneling). Our work shows connecting to a distant VPN server has a profound effect on Zoom quality.
Figure 4 shows the client-level Shapley analysis. The client’s most dominant feature is the number of clients on the AP, which is 110, leading to a predicted increase (or Shapley value) of 150 ms to the latency. This is followed by the round-trip time of 196 ms, corresponding to a Shapley value of 73.9 ms. The client-level graph shows all the Shapley values for each feature, adding up to the predicted latency (262.95 ms) starting from the average latency (33.55 ms).
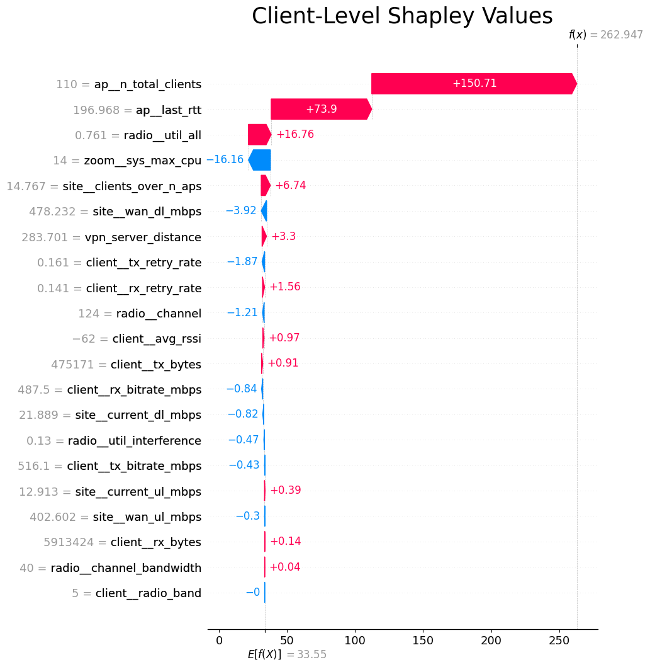
Figure 4: Client-level Shapley analysis
The Juniper Mist offering predicts and explains latency for both Zoom and Teams calls. This prediction and explainability can expand to other applications and other network features. Since our model is regularly updated with the most recent data, the model adapts to any organization, site or access point changes over time and surfaces the most impactful features that contribute to specific issues or problems, thus showing Juniper Mist’s commitment to employ AI techniques to democratize understanding with evidence-based, up-to-date and objective decision-making.
Juniper Mist predicts latency and ranks “feature” impact for latency, allowing IT staff with the right privileges to rapidly delve into “why” and decrease the Mean Time to Innocence (MTTI) for in-path nodes and services.
Juniper sets the standard for wired, wireless and location services providing an AI-driven cloud architecture that is reliable and measurable for the best user experiences and OpEx savings. Our integration work with Zoom and Teams exemplifies how we set the bar with AIOps. We invite you to learn more about the Zoom integration and Marvis by visiting the Marvis product page on juniper.net and seeing the Zoom integration in action here.


