This blog was originally published to the Apstra website – in 2021, Juniper Networks acquired Apstra. Learn more about the acquisition here.
 In my previous blog on Intent-Based Networking (IBN) I tried to provide some clarity about our vision of what IBN is, and what it is not. We stressed the importance of automating each and every phase of a service lifecycle by leveraging a single source of truth. Arguably, the most important phase is “closed-loop validation in the presence of change”. And at the core of it is what we call Intent-Based Analytics (IBA). Let’s define it and dig deeper into it.
Definition
The most important aspect of IBA is its ability to reason about the change in the closed-loop fashion. And the change can take place during any of the service lifecycle phases: design, build, deploy or validate. During the design phase I may want to add a rack. Or I may want to add a new virtual network or isolation domain. During the build phase I may want to change some IP or ASN assignments. Or swap an instance of a vendor A device with an instance of a vendor B device. During the deploy phase I may want to roll-back some of the changes. Or I want to tweak the way config is generated. But the key question is: have these changes produced the expected results?
As we mentioned earlier, changes can originate from an operator (business rule change). Could the AWS outage of February 2017 have been prevented if the automation system had semantic reasoning about the impact of the change? You could have a semantic validation that will allow an operator for example to have at most two, or at most 10% (whichever is smaller) of spine switches placed into “maintenance” mode at any given time. And if you intend to go over that limit, semantic validation will prevent you from doing it.
In the case of operational status changes, it is even more important to reason about the changes in closed-loop. This is because (a) you are not in control of the change, as you don’t control the nature, let alone your data center gear (b) there could be thousands of these changes happening instantaneously and you need to be able to handle this at scale. But wait; operational status is not part of the intent, is it? Of course it is. Intent is not only about configuring devices using a declarative specification of intent. (For more details about Apstra’s definition of IBN see these videos from NFD16) . It is even more importantly about specifying your expectations. You expect your Spine1 switch to be up. You expect Ethernet5 on it to be down. If they are not you want the anomaly to be raised. You want the right people to be alerted. You want to reason about the change in the context of intent in an automated, programmatic way.
In the examples above, Spine1 was treated as an indispensable and unique system with identity, that can never be down. In the “pets” vs “cattle” analogy, Spine1 is your “pet”. But what if you designed your system for failure, and no system was indispensable or irreplaceable, i.e. you “routed around the failure”? You want to know how the ensemble “cattle” is doing. There is no single operational status to answer that. You need to synthesize that operational status by extracting knowledge from a multitude of raw telemetry data. And all of this in the context of intent that serves as your single source of truth. So what does “extracting knowledge” actually mean in this context?
Say for example you have a complex application “myApp”, that has multiple components running as VMs/containers on multiple servers, spread across racks in your data center. The servers fail and as a result workloads move around. Or the workload placement algorithm moves them around for optimization purposes. You don’t have “pet” servers on which your “pet” application is running. But you do want to know how your app is doing. So you may say for example, “I want a sufficiently large percentage of the links that carry the traffic of ‘myApp’ to (a) be up, and (b) not overloaded”.
Challenges and Solutions
So, what are the challenges associated with the ask above?
Challenge 1: Identifying Relevant Resources
The first challenge is identifying these links in the presence of change. You may not have the single source of truth to give you this info. Or the source of truth may not be up to date. Or it was updated but you are not notified of the change. My cabling is in spreadsheet A and my VM placement information is in system B. You could solve the above with some scripting around the limitations, but in general building an asynchronous notification mechanism from scratch is a daunting task.
Solution: In Apstra Operating System (AOS®), these complexities are handled by the core platform. So how does this information get into AOS in the first place? Consider the two scenarios. In the first scenario, AOS is not controlling the placement of workloads. If this is done externally you need to update AOS with the mapping of VMs to servers via well-defined and published APIs. This could be a simple integration. In the second scenario, you build a reference design that runs the workload placement within AOS, and as a result, AOS is aware of it, and nothing extra needs to be done.
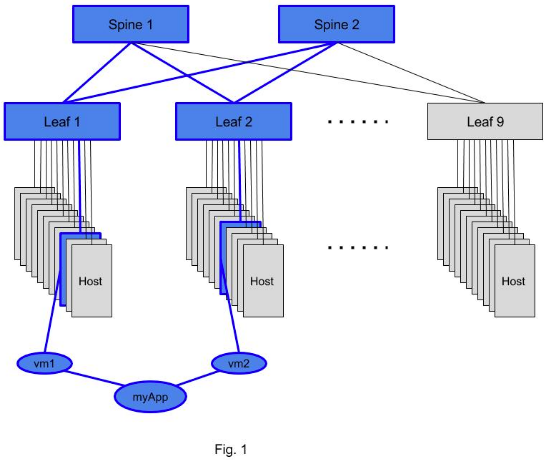
Once the info is in AOS you can use a Live Query pattern to identify the links of interests. To put it in plain English you ask a question: “What are the links that carry traffic between VMs that comprise the application ‘myApp’, and notify me of any change from now on?”. In the Fig 1. below we see myApp consisting of two VMs that are hosted on some servers attached to leafs 1 and 2. The set of links and switches that carry the traffic of interest are highlighted in blue in Fig. 1.
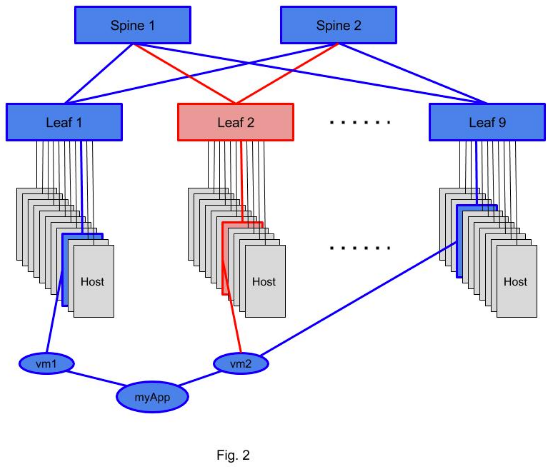
Now, suppose a change took place resulting in moving the vm2 to a server on leaf 9. There is a set of links and switches that is not carrying myApp traffic any more and these are highlighted in red in Fig. 2. And this fact will be communicated via Live Query to AOS so that the telemetry on these links is not any more included in the calculations. Additionally, the new resources, that do need to be included in the calculations (new server hosting vm2 attached to leaf 9 and associated links) are also communicated to AOS via Live Query pattern.
Now you have a continuously up to date picture of resources that matters to you. Challenge 1 solved with AOS.
Challenge 2: I don’t have the required (raw) telemetry
The more data you have and know how to reason about, the more powerful your analytics are.
Solution: AOS supports the quick and easy addition of new data via telemetry collection extensions. Look for upcoming blogs on this topic.
Challenge 3: Composing The Analytics Workflow
The next challenge is that the raw telemetry data may not be sufficient for you. It may tell you that a link is “up” now, but is that enough info given that it was possibly down for 2 minutes just before you checked? So an instantaneous state may not be what you care about, but rather some “aggregated” information about recent history. Say you wanted it to be “up” for 99.9% of time in the last 1hr and “down” not more than 1s during any “down” event. Otherwise you declare its recent connectivity status as “unhealthy”. And regarding the traffic being overloaded on the links, you may want it not to be overloaded (over certain configurable threshold) for example for more than 5s for as you are ok with occasional spikes. Otherwise you declare it “overloaded”.
Also, say you have built some resiliency into your application and can tolerate up to 10% of the links being “unhealthy” or “overloaded” (or both). Otherwise you want an anomaly, “myApp network has an issue,” raised and encapsulating all the complex knowledge extraction described above. And this extraction was implemented by a logical data processing workflow consisting of the following stages (Fig. 3 below):
- Collect statuses from all links carrying “myApp” traffic
- Collect traffic utilization info from all links carrying “myApp” traffic
- Create recent history time series (denoted as “TS” in Fig. 3) for the two metrics above
- Perform the analysis on the time series to calculate time spent in “up”/”down” states and time over the utilization threshold.
- Combine the results to calculate the percentage of “unhealthy” or “overloaded” links
- Raise an anomaly if more than 5% of links is “unhealthy” or “overloaded” or both
This logical analytics workflow is essentially a directed acyclic graph of stages where each of the stages is one of (a) accumulation of resources of interest, (b) post-processing of telemetry, (c ) some conditional expression that raises an anomaly.
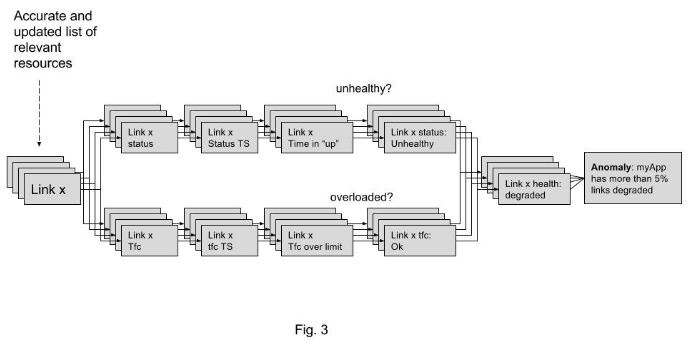
Now, assuming you solved challenges 1 and 2 (have the right resources dynamically updated and have all the required telemetry available). You have two options (a) implement this logical knowledge extraction workflow in your mind by staring at a “dashboard” with tens or hundreds of plots, each corresponding to a stage in the Fig. 3 and doing the correlation in your mind, or (b) building from scratch your analytics workflow engine.
Solution: Wouldn’t it be nice if you could achieve the above by designing such a logical workflow, specifying it declaratively (as a directed graph of stages) and then deploying it with a single POST request to AOS, and have the rest done automatically? Challenge 3 solved with AOS.
Ok, we got this information-rich anomaly. Is there anything else one may want to do?
Challenge 4: Automated Drill-down
Say now you identified that a number of unhealthy/overloaded links is higher than your application can tolerate. What do you want to do about it? Ideally, you may want to follow-up with the next level of investigation and troubleshooting. But to do that you again need a system that stores all relevant context (single source of truth), that you can ask the right questions (reason programmatically) in the presence of change (asynchronously). Building it from scratch? Daunting.
Solution: Again all of these features are an essential part of AOS. It takes your intent as context. It reacts to change. It synthesizes complex anomalies programmatically. And then you can react to these anomalies to automatically trigger the next level of detailed follow-ups that you could not afford (or did not want) to do all the time, across all the resources. For example given the above anomaly raised you may want to do one or more of the following, by leveraging the same mechanism used for any reasoning logic in AOS – the Live Query mechanism. It would react to creation of the above anomaly and then during the processing stage (callback function) of the Live Query:
- Initiate the next level of telemetry to identify which flows are contributing to overloaded links, and try to identify elephant flows
- Take a snapshot of relevant info (which other applications were running on the servers experiencing problems)
- Log the info above for post mortem analysis
- Any other secret technique under your belt
Best of all, these follow-up actions are simply just the next set of stages in our knowledge extraction analytics workflow. Challenge 4 solved by AOS.
Epilogue
If you were to do this yourself, in the absence of a single source of truth that you can programmatically reason about in the presence of change (which is functionality provided by AOS Core) you would have to do the following:
- Provide a coordination layer that will consolidate different sources of truth
- Make that coordination layer capable of providing granular asynchronous notifications
- Have a way to define your domain model and persist it
- Have a framework to auto execute tests driven by your domain model
- Build from scratch or manage a 3rd party data processing pipeline
One of my favourite quotes comes from Mike O’Dell, who was a pioneer in building likely the most sophisticated MPLS network at the time, UUNET. I attended one of his presentations about challenges in building MPLS networks and his first slide had the following text: “If you are not scared, you don’t understand.” So, if you feel scared trying to build from scratch the system described above, that is a good sign. You are not alone. Whether you really want to do it, is a different question.
Now imagine if you can achieve the above by designing such a workflow. Specify it declaratively (as a directed graph of stages), deploy it with a single POST request. Have AOS automate the collection of the telemetry, creating a data processing pipeline, resulting in actionable and context rich data, including, but not limited to raising the anomalies. Extract more knowledge while collecting less data. Or better yet, forget about the “imagine” part above, and stay tuned.


