From improving occupant and visitor experiences to gaining a competitive edge and optimizing for green initiatives, facility utilization and occupancy insights are invaluable in retail stores, offices, hospitals, and educational institutions. However, for facilities, real estate, and business managers, tracking building usage efficiently, accurately, and non-invasively over extended periods to gain actionable insights is easier said than done.
This blog explores the gaps in traditional facilities management analytics and highlights how Juniper Mist™ Occupancy Analytics’ unique capabilities unlock unprecedented insights, helping to ensure buildings and grounds are comfortable, well-organized, safe, and used efficiently.
What’s been missing?
Traditional facilities management analytics have several key shortcomings that limit the value of their space utilization and resource allocation insights:
- Lack of granularity: Most analytics provide only high-level data, which is not sufficiently detailed to make informed decisions about specific areas within a facility
- Reliance on static or siloed data: They frequently rely on static or siloed data sources and lack capabilities for capturing real-time, dynamic changes in space usage
- Inflexibility in tracking long-term trends: Solutions typically only provide short-term windows into trends, making it difficult for managers to accurately identify patterns and plan proactively over longer periods
- Limited adaptability across industries: Many analytics systems provide overly generalized insights that fail to address the unique needs of healthcare, education, retail, and other environments
Go deeper with Juniper Mist Occupancy Analytics
Juniper’s occupancy and engagement analytics in Premium Analytics subscriptions offer more than just high-level data. Built on data from Juniper’s powerful Wi-Fi access points with integrated Bluetooth® LE (BLE), this solution provides deep insights into user behavior and movement within your facilities.
By leveraging advanced technology, Juniper delivers detailed analytics that go beyond traditional solutions, helping you truly understand how spaces are being utilized and enhancing your ability to make informed decisions. Whether you’re managing large corporate offices, retail stores, hospitals, or university campuses, our data-driven analytics deliver the information and statistics you need to make informed decisions about space utilization, based on concepts such as:
- Foot traffic
- Dwell time
- Zone occupancy
For example, if you’re running a retail store, you can track how customer foot traffic shifts throughout the year and adjust staffing or inventory levels accordingly. In hospitals, understanding daily patient flow patterns can help optimize wait times and improve the patient experience. Educational institutions can gain insights into student usage patterns across buildings, libraries, and classrooms, enabling better campus and building management during peak periods throughout the school year.

Figure 1. Observe total and loyalty visitors by day/week/month
Unlocking high-traffic zones and dwell times over the long term
Understanding where users spend the most time within your facilities is critical for making informed decisions about building floorplans and resource distribution. Our dashboards identify high-traffic zones and provide data on dwell times, or how long users stay in specific areas, for a period of up to 13 months. This capability is particularly useful in retail environments for optimizing product placements; in office environments for programming lighting, HVAC and alarms; and in hospitals and offices to manage congestion and improve user flow.

Figure 2. Visitor/device dwell times for various areas in a facility
With insights from Mist Occupancy Analytics, your decision makers can adjust layouts or implement strategies to improve user experiences, such as relocating services or staff to where they are needed most. In a retail setting, for example, you might discover that customers spend more time in one section of the store or move from one area to another repeatedly, prompting a redesign to better utilize that space.
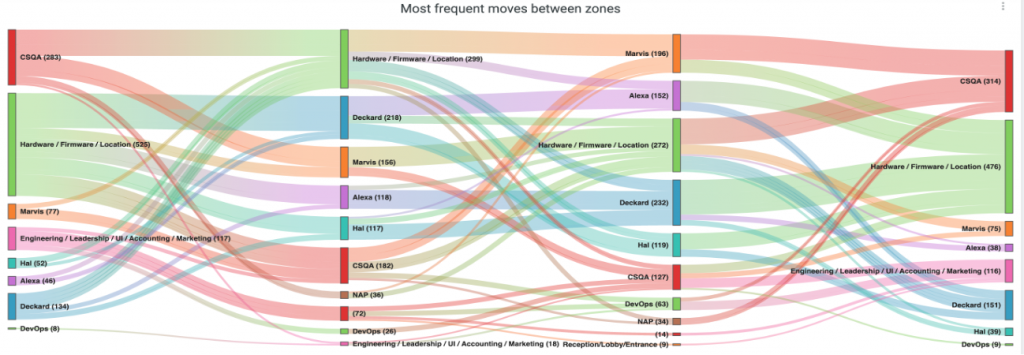
Figure 3. See how occupants move from one area of a facility to another over days, weeks, or months
Timeline trends: spotting patterns to optimize operations
The ability to change the timeline perspective (hours/days/months) in the various dashboards allows you to monitor changes in behavior over time. These trends can reveal shifts in how facilities are being used and help managers anticipate needs before they become issues. Operations and facilities teams can proactively address changing demands, such as adjusting heating, lighting, or staffing levels based on expected occupancy. This can also enable real estate management teams to view space utilization over time and make better portfolio decisions in the future.
 Figure 4. Example dashboard filters for report period, device types, and SSIDs
Advanced applications across industries
Retail
- Foot traffic analysis: Understand customer movements and peak times to optimize staffing and layout
- High-traffic zones: Pinpoint areas with the highest density and optimize those zones for better performance and safety
- Customer engagement: Analyze dwell times and repeat visits for targeted marketing strategies
Healthcare facilities
- Patient flow optimization: Use occupancy data to streamline patient movement, reducing wait times and enhancing the overall patient experience
- Patient census: Understand patient needs during peak times for informed staffing decisions
- Operational efficiency: Plan resource allocations based on historical occupancy insights
Educational institutions
- Resource allocation: Optimize the use of classrooms, libraries, and common areas by analyzing peak usage times
- Classroom technology: Ensure appropriate technology is available in classrooms when needed (for example, projectors, printers, and lab supplies)
- Campus experience: Enhance student and staff experiences by understanding their interactions with the campus environment
Enterprise/office workspaces
- Hybrid work: Optimize desk space usage for hybrid and hoteling employees
- Return-to-office mandates: Understand office occupancy and employee participation over extended time periods
- Energy management: Identify energy usage patterns, set sustainability goals, and control and optimize smart lighting and HVAC to avoid unnecessary costs
Taking facility and real estate management to the next level
Location-based technologies are transforming the art of the possible in facility and real estate management. As part of Juniper’s Premium Analytics subscription, insights provided by Juniper Occupancy and Engagement Analytics empower your organization to make smart, informed decisions about how to use and optimize space based on actual facility usage patterns. Whether you’re looking to streamline operations, improve user experiences, or enhance resource allocation, our dashboards provide the data you and your business need to succeed.
Learn more about Juniper Mist Premium Analytics
Get the Juniper Mist Premium Analytics datasheet
Watch Juniper Mist Premium Analytics – NOW in 60 seconds
Watch Business Insights in Juniper Mist Premium Analytics – NOW in 60 seconds


