In the ever-evolving landscape of IT Services, insights give us an accurate and deep understanding of how or why something happens. When delivering any IT service, it’s always been crucial to monitor and observe services and their states. To deliver great user and operator experiences, it’s also imperative to understand how supporting services and dependencies positively contribute to or negatively affect services. Without informed insight, efforts to reason about, fix or improve, services are often misguided, and valuable time gets wasted on anecdotal rather than empirical evidence.
IT service footprints and their dependencies continue to grow in depth, breadth and complexity. Help beyond traditional monitoring and shallow observability is needed. This is where Juniper Mist’s AI-powered insights and AIOps (AI Operations for IT) can reach further and faster, by surfacing anomalies, identifying the right dependencies and offering to address issues before they become problems.
Lessening the burden of operational support and empowering teams with the ability to give service assurances begins with new and broader forms of insight that can reach further, faster and deeper. Clients already have their own service level expectations, but the question is, what’s actually measurable, accurate and actionable when delivering IT experiences?
From Service Level Expectations (SLEs) to Assurances
Wired networks are expected to transport packets reliably and quickly, but how do we measure this? Do we monitor and measure aggregate values, individual client experiences, device health or the state of different types of application flows transiting a network? We require many different types of metrics to be able to reason about performance and reliability, particularly so from the point of view of an individual client device. The network can look and feel differently depending on where we start and observe from. This means making assurances are a complex undertaking, and achieving desired service levels becomes a non-trivial undertaking.
We require measurements and better observability from multiple points in the network and use a range of different methods. This data must then be combined and processed to form simple and actionable outcomes for operators and support teams. Goal and objective setting for complicated and complex services lead us to use Service Level Expectations (SLEs). Using expectations rather than agreements means SLEs can be easily adjusted and can facilitate continuous improvement without incurring penalties or requiring revising legal contracts. SLEs can also be used as automation triggers that fuel further AIOps and underpin wired assurance from end to end. Let’s look at some examples, including what types of classifications roll up to common types of issues that AI-powered insights make short work of.
Successful Connects
One of the most frustrating stumbling blocks for users can often be connecting to the network in the first place. With authentication on a wired network, issues can be non-trivial to diagnose for first line support, especially when specific infrastructure interfaces are involved. Successfully connecting can often be quite complex under the hood when authentication and required dependencies are considered.

Without getting lost in the weeds, AI-powered insights can rapidly highlight any connection issues, including who is impacted and what devices and interfaces are affected. This means support and engineering teams can stay one step ahead of client-facing problems with direct diagnoses and the required remediations, all wrapped in timely and clear communication.
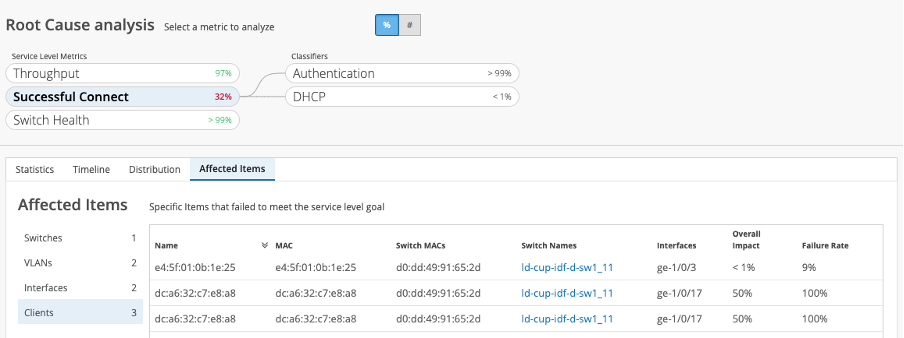
Rapid root-cause analysis is only a click away. The associated impact can be seen across affected switches, VLANs, interfaces and clients. Not only can the timelines be surfaced, but the distribution and detail can be seen across:
- Authentication
- DHCP (Requires DHCP snooping)
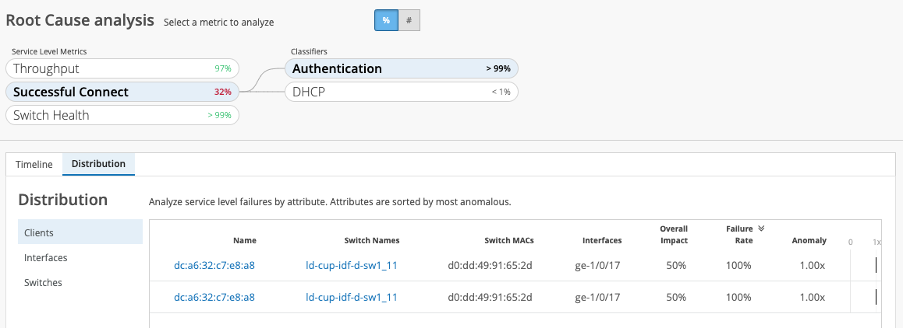
Saving time and improving communication is hugely beneficial, but by amplifying observability with AI-powered insights and then having the capability to hone in on the root cause of a localized or widespread issue, operators and support teams accelerate and are empowered to improve the user experience continuously.
Additionally, determining whether clients, interfaces, switches or VLANs are having problems with DHCP means less endpoint troubleshooting for teams and users. It gives deeper insight into the performance of such critical dependencies as network reachability for the access edge rises and falls on the integrity and functioning of DHCP services.
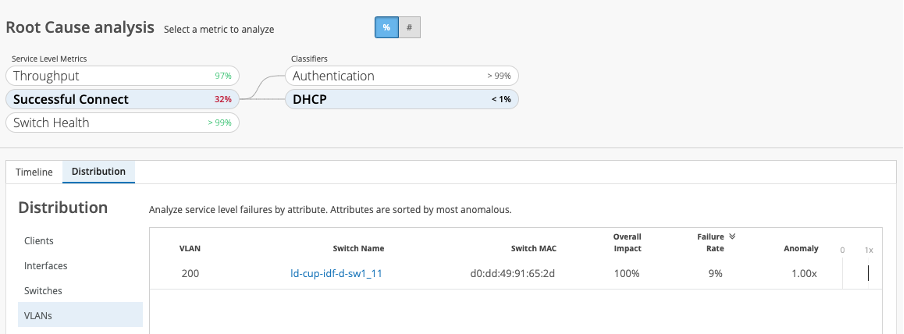
The ability to discern what and where issues are arising, how often and when, becomes a superpower for all tiers of support and engineering. Identifying who is affected, sometimes before they even know they’ve been affected, gives a sense of agency and confidence back to teams as they collaborate with colleagues to support their clients. Reducing support tickets, improving Mean Time to Repair (MTTR) and meeting or exceeding service levels have never been so achievable.
Throughput
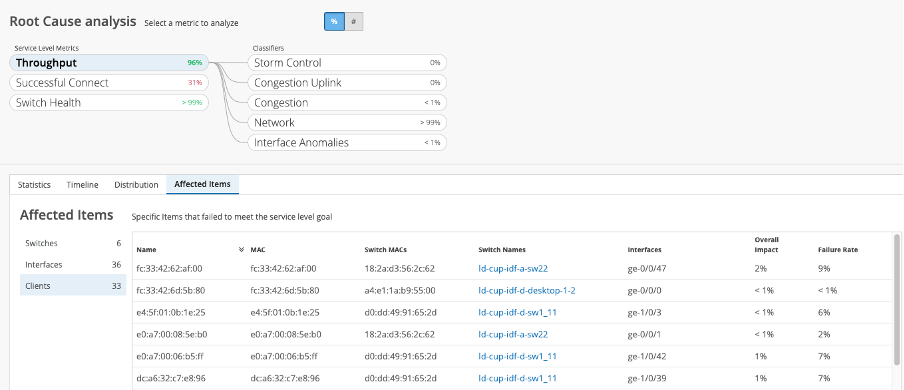
It’s always been difficult to figure out how much throughput users get either individually or in aggregate. Monitoring infrastructure links may be thought of as table stakes but understanding the role that temporary or intermittent congestion plays, and then attributing user experience issues to it, is a more complicated and difficult proposition. With AI-powered insights, identifying the degree to which congestion or other factors affect throughput, and then breaking it down by client, device or VLAN, becomes simple.

Root cause analysis is just one click away in “Monitor/Service Levels” and includes the ability to immediately surface and understand what entities are affected across clients, interfaces and switches.
Even latency and jitter distributions across VLANs are sorted by the degree of anomaly.
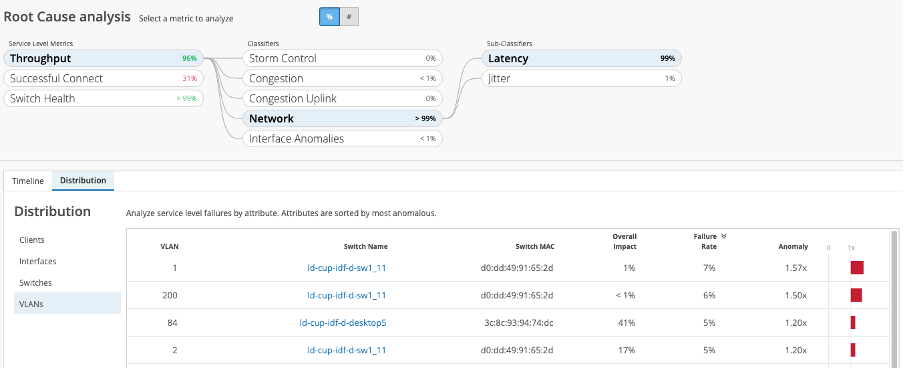
By clicking through the classifiers and sub-classifiers, the full picture becomes visible and then actionable, all broken down by:
- Storm control
- Congestion
- Congestion uplink (contribution to failed throughput)
- Network (jitter and latency)
- Interface abnormalities (cable issues, MTU mismatch, negotiation failed)
Immediate AI-powered insights that are based on empirical data empower operators and support teams to act with confidence and clarity.
Switch Health
Finally, infrastructure device health can still sometimes be overlooked until it’s too late. Unhealthy infrastructure can contribute to a whole suite of problems, including some that occur unpredictably or are difficult to detect using regular monitoring methods. Insights across a range of sub-classifiers mean AI-powered insights can spot anomalies (not just thresholds) across:
- Memory
- CPU
- Power
- Temperature
- Switch reachability
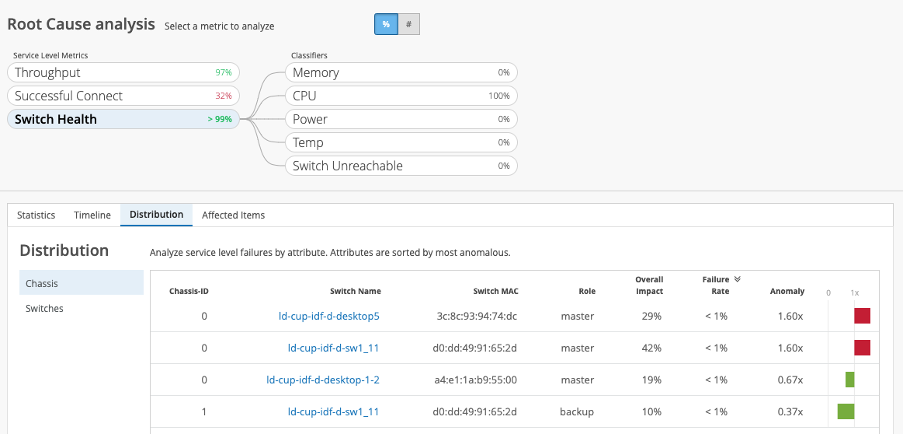
With an operator leaning focus and huge potential user impact, switch health is something that can and never should be compromised or ignored. Identifying which devices, and even specific chassis, are having issues becomes paramount.

AIOps Customer Story Example: University of Texas at Arlington
University of Texas at Arlington, located in the heart of Dallas-Fort Worth – the second largest institution in The University of Texas system – has been widely recognized as a best value in education by Forbes and others. When the COVID-19 pandemic first swept Texas, UTA quickly pivoted to e-learning and remote work. That agility was enabled by AI-driven Juniper networking from the classrooms and research labs to the data center and cloud apps. Learn more here.
Leveraging AIOps
AIOps can enhance IT teams, scale their capabilities and save everyone’s time to allow for focus on higher impact tasks and projects. Remove operational toil and get out of the weeds to re-focus on measurable service levels and improve user experiences empirically. Use Juniper Mist AIOps as a force multiplier to redefine everyone’s expectations of network and service delivery.
Next, check out how AI-powered troubleshooting assures everyone, from users to stakeholders, that the next steps are actionable and explainable.
- Try Wired Assurance today! Click here for a free 90 day trial of Wired Assurance.
- Join our weekly demos to see how you can drive better user experiences across the wired, wireless and WAN through Mist AI!


