In January 2024, Juniper introduced the AI-Native Networking Platform to leverage the right data via the right infrastructure to deliver the right responses for optimal user and operator experiences. Using AI for simplified networking operations (AI for networking) and AI-optimized Ethernet fabrics for improved AI workload and GPU performance (networking for AI), Juniper is delivering on our customer commitment of experience-first networking.
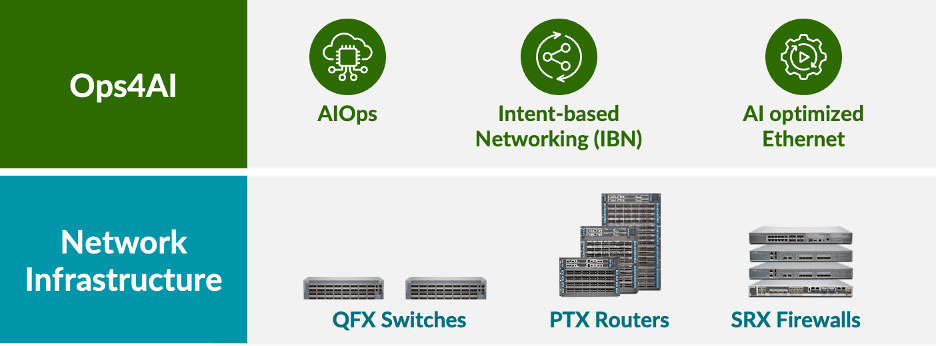
Building on our rich history of providing high-performance secure data center network infrastructure, consisting of QFX switches, PTX routers and SRX firewalls, Juniper is proud to announce an extension of our AI-Native Networking architecture giving customers end-to-end, multivendor operations for AI data centers. Our new solution, Ops4AI, offers impactful enhancements that will further deliver significant value to customers. Ops4AI includes a unique combination of the following Juniper Networks components:
- AIOps in the data center built upon the Marvis Virtual Network Assistant
- Intent-based automation via Juniper Apstra multivendor data center fabric management
- AI-optimized Ethernet capabilities, including RoCEv2 for IPv4/v6, congestion management, efficient load-balancing, and telemetry
Together, Ops4AI enables rapid acceleration of time-to-value of high-performing AI data centers while simultaneously reducing operational costs and streamlining processes. And now the solution is getting even better with the addition of several new enhancements: A new multivendor Juniper Ops4AI Lab open to customers for testing open source and private AI models and workloads; Juniper Validated Designs that assure networking for AI configurations using Juniper, Broadcom, Intel, Nvidia, WEKA, and other partners; and enhancements to Junos® software and Juniper Apstra for AI-optimized data center networking – a primary focus of this blog.
Let’s look at the new enhancements to Junos software and Juniper Apstra. They include:
Fabric autotuning for AI
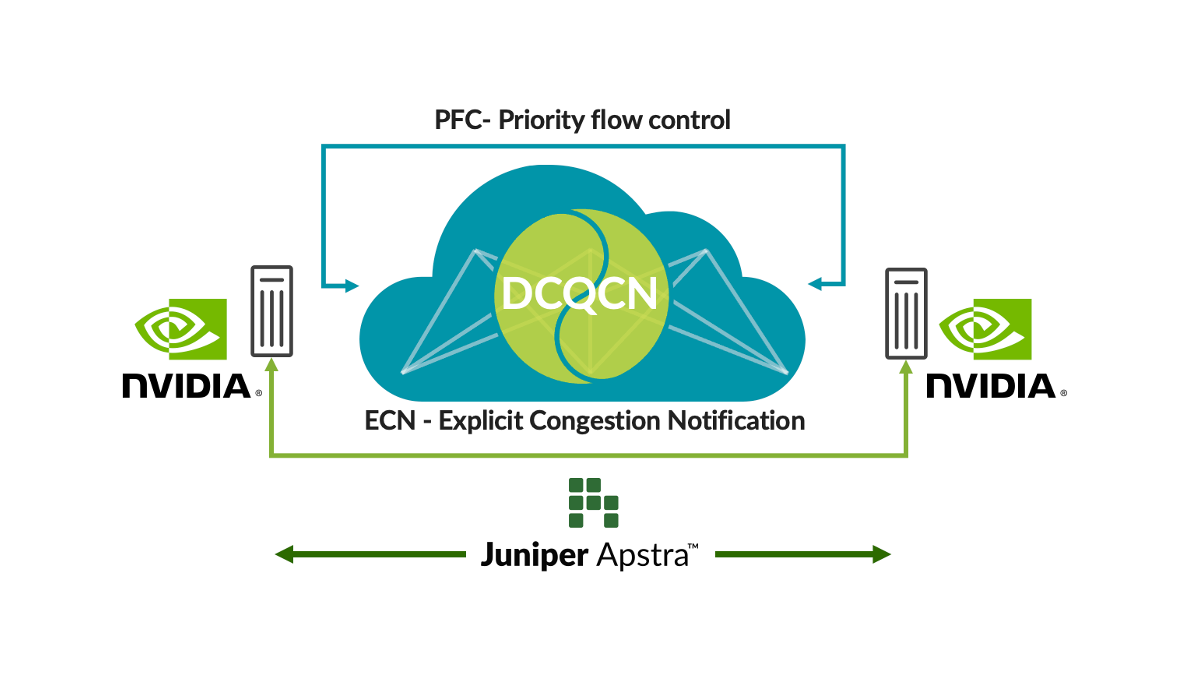
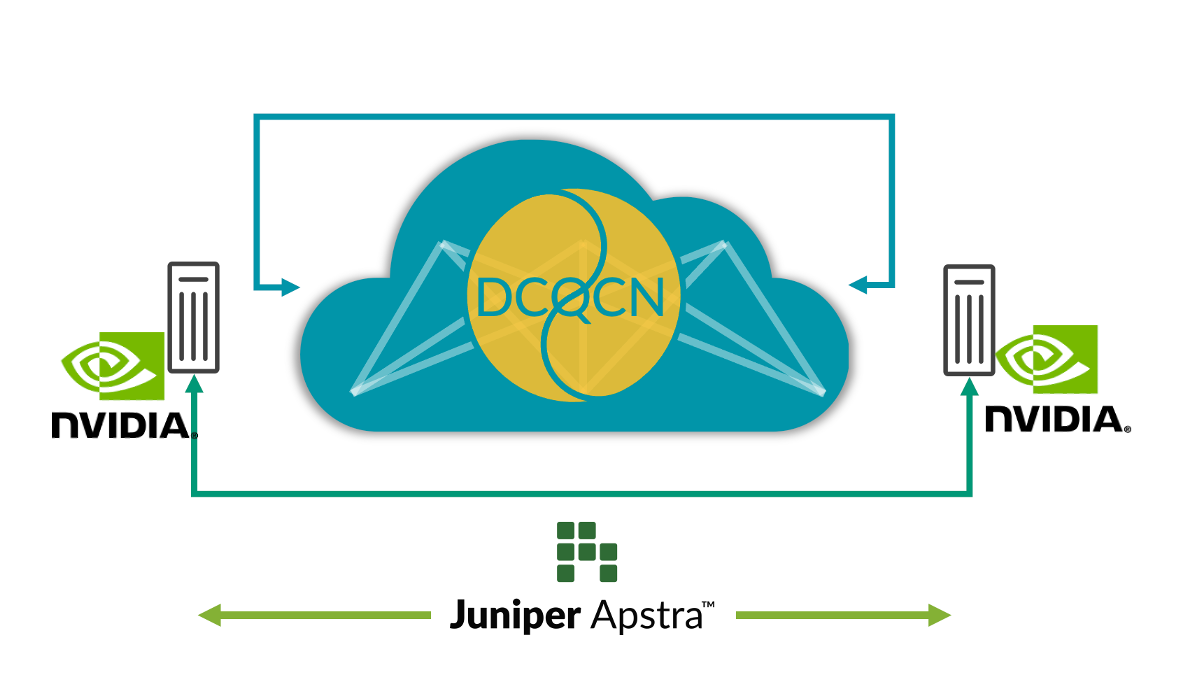
Remote Direct Memory Access (RDMA) from GPUs drives massive network traffic in AI networks. Despite congestion avoidance techniques like load-balancing, there are situations when there is congestion (e.g., traffic from multiple GPUs going to a single GPU at the last hop switch). When this occurs, customers use congestion control techniques such as Data Center Quantified Congestion Notification (DCQCN). DCQCN uses features like Explicit Congestion Notification (ECN) and Priority-Based Flow Control (PFC) to calculate and configure parameter settings to get the best performance for each queue for each port across all switches. Setting these across thousands of queues across all switches manually is difficult and error-prone.
To address this problem, Juniper Apstra regularly collects telemetry from each of these queues for each of the ports. That telemetry information is used to calculate the most optimal ECN and PFC parameter settings for each queue for each port. Using closed-loop automation, the optimal settings are configured on all the switches in the network.
This solution provides the most optimal congestion control settings, simplifying operations significantly and delivering lower latency and job completion times (JCTs). Our customers are investing so heavily in AI infrastructure that we’ve made these features available now in Juniper Apstra at no extra charge. Watch a demo from the latest Cloud Field Day to see how they work up close. We have also uploaded this application to GitHub.
Global load-balancing
AI network traffic has unique characteristics. It is mostly driven by RDMA traffic from GPUs, which results in high bandwidth and fewer, but bigger, flows (often referred to as elephant flows). As a result, static load-balancing based on 5-tuple hash doesn’t work well. Multiple elephant flows map to the same link and cause congestion. That results in slower JCTs, which is devastating for large GPU investments.
To address the issue, dynamic load-balancing (DLB) is available. DLB takes uplink state on the local switch into account.
Compared to traditional static load balancing, DLB significantly enhances fabric bandwidth utilization. But one of DLB’s limitations is that it only tracks the quality of local links instead of understanding the whole path quality from ingress to egress node. Let’s say we have CLOS topology and server 1 and server 2 are both trying to send data called flow-1 and flow-2, respectively. In the case of DLB, leaf-1 only knows the local links utilization and makes decisions based solely on the local switch quality table where local links may be in perfect state. But if you use GLB, you can understand the whole path quality where congestion issues are present within the spine-leaf level.
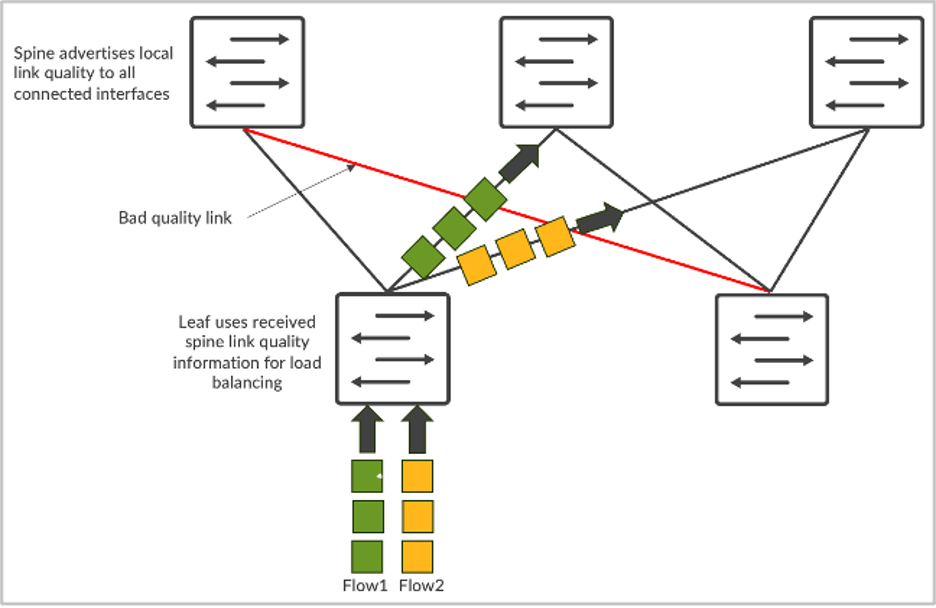
It’s similar to Google Maps where the route selected is based on an end-to-end view.
This feature selects the optimal network path and delivers lower latency, better network utilization, and faster JCTs. From the AI workload perspective, this results in better AI workload performance and higher utilization of expensive GPUs.
End-to-end visibility from network to SmartNICs
Today, admins can find out where congestion occurs by observing only the network switches. But they don’t have any visibility into which endpoints (GPUs, in the case of AI data centers) are impacted by the congestion. This leads to challenges in identifying and resolving performance issues. In a multi-training job environment, just by looking at switch telemetry, it is impossible to find which training jobs have been slowed down due to congestion without manually checking the NIC RoCE v2 stats on all the servers, which is not practical.
To address the issue, integrating rich RoCE v2 streaming telemetry from the AI Server SmartNICs to Juniper Apstra and correlating existing network switch telemetry greatly enhances the observability and debugging workflows when performance issues occur. This correlation allows for a more holistic network view and a better understanding of the relationships between AI servers and network behaviors. The real-time data provides insights into network performance, traffic patterns, potential congestion points, and impacted endpoints, helping identify performance bottlenecks and anomalies.
This capability enhances network observability, simplifies debugging performance issues, and helps improve overall network performance by taking closed-loop actions. For instance, monitoring out-of-order packets in the SmartNICs can help tune the parameters in the smart load-balancing feature on the switch. Thus, end-to-end visibility can help users run AI infrastructure at peak performance.
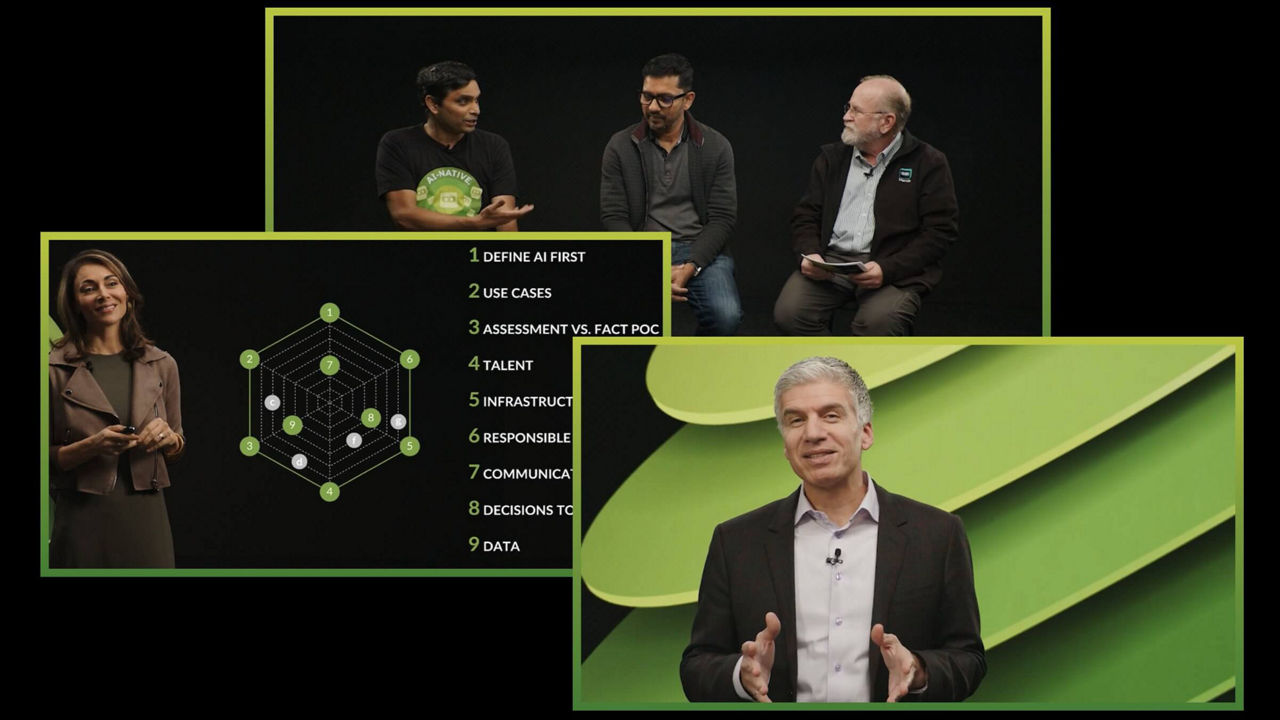
To learn more, be sure to attend “Seize the AI Moment”, our online event, on July 23 where we have an all-star lineup of Juniper customers and industry luminaries to talk about what they’ve learned in the rapidly developing world of AI data center infrastructure.
Statement of Product Direction. Juniper Networks may disclose information related to development and plans for future products, features or enhancements, known as a Statement of Product Direction or Plan of Record (“POR”). These details provided are based on Juniper’s current development efforts and plans. These development efforts and plans are subject to change at Juniper’s sole discretion, without notice. Except as may be set forth in a definitive agreement, Juniper Networks provides no assurances and assumes no responsibility to introduce products, features or enhancements described in this website, presentation, meeting, or publication, nor is Juniper liable for any loss arising out of reliance on the POR. Purchasing decisions by third-parties should not be based on this POR, and no purchases are contingent upon Juniper Networks delivering any feature or functionality described in this website, presentation, meeting, or publication.


